

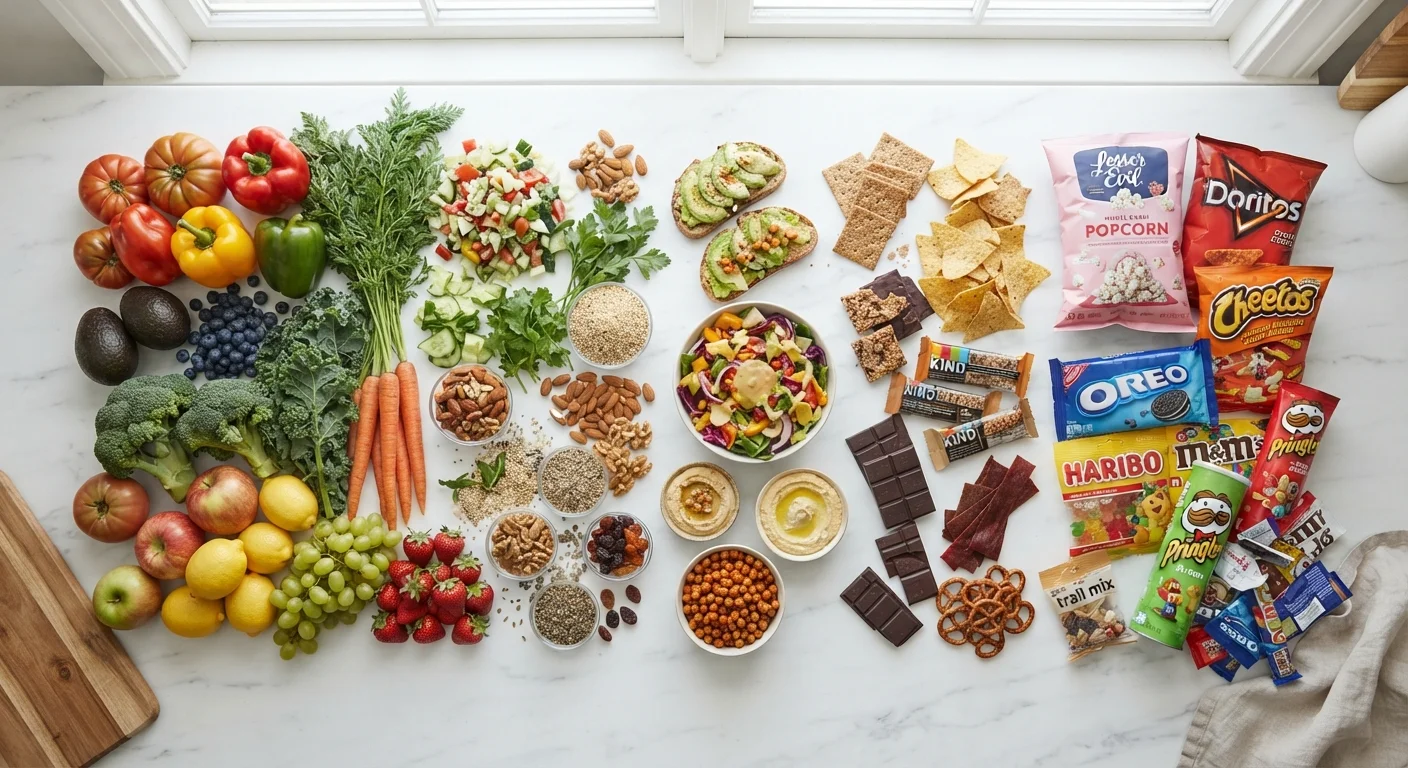
Key Takeaways
- Processing is not binary: a frozen pea and a cheese puff are both processed, but very differently.
- The NOVA system groups foods into four levels based on how and why they are processed.
- Minimal processing, such as freezing or drying, generally preserves nutritional value.
- Ultra-processed foods are industrially formulated and typically high in added sugar, sodium, and saturated fat.
- Reading ingredient lists, not just nutrition panels, helps identify how heavily processed a product is.
- This article is general nutrition education, not personal dietary advice.
Food processing spectrum
Food processing describes any deliberate change made to a raw ingredient before it reaches your plate. Those changes range from washing and cutting to industrial formulations with dozens of added ingredients. Classifying foods along a spectrum rather than sorting them into "processed" versus "unprocessed" gives a more accurate picture of how different foods are made and how they differ nutritionally.
The NOVA classification system, developed by researchers at the University of Sao Paulo, is the most widely cited framework for grouping foods by degree and purpose of processing. It defines four groups from minimally processed to ultra-processed.
Why "processed" alone tells you very little
The word processed appears on social media as a shorthand for unhealthy, but it covers everything from pasteurized milk to fluorescent cheese crackers. Lumping those together produces confusion rather than clarity. A more useful approach is to think about how much processing occurred and why.
Researchers have proposed several classification frameworks. The NOVA system, which came out of nutrition research at the University of Sao Paulo, groups foods into four levels based on the nature, extent, and purpose of the processing applied. It has limitations, and it is not the only tool scientists use, but it provides a concrete way to distinguish a bag of frozen spinach from a packaged snack cake.
NOVA has critics too
Some nutrition scientists argue that NOVA overreaches by grouping foods with very different nutritional profiles into the same ultra-processed category. For example, plain wholegrain bread made with a few industrial steps and a nutrient-poor snack cake both potentially qualify as Group 4. Researchers continue to refine how processing level should be measured alongside traditional nutrient metrics.
The four levels of the processing spectrum
Group 1: minimally processed
These are whole foods that have been cleaned, cut, frozen, dried, or fermented without adding salt, sugar, or fat. Fresh produce, plain frozen vegetables, dried legumes, and plain yogurt without sweeteners fall here. Freezing and drying can actually preserve micronutrients that degrade during lengthy storage or shipping of "fresh" items.
Group 2: culinary ingredients
Oils, flours, butter, and sugar are extracted or refined from natural sources. They are not eaten alone; they are ingredients used to prepare Group 1 foods. This group gets a mixed reputation because of refined carbohydrates and saturated fats, but context matters. A small amount of olive oil used to cook vegetables behaves very differently nutritionally than the same oil used as a base for a commercially fried product.
Group 3: processed foods
These combine Group 1 and Group 2 items, sometimes with salt, vinegar, or simple preservatives, to extend shelf life or alter texture. Canned tomatoes with salt, cheese, cured meats, and bread with a short ingredient list belong here. Sodium content is the most common nutritional concern at this level.
Group 4: ultra-processed
Ultra-processed products are industrially formulated using refined ingredients and additives that go well beyond preservation. Emulsifiers, colorants, artificial flavors, modified starches, and sweeteners appear throughout their ingredient lists. Mass-market soft drinks, packaged pastries, flavored chips, and many fast-food items fall here. These products are typically engineered for palatability rather than nutritional density, and they tend to be calorie-dense while low in fiber, vitamins, and minerals.
57%
Share of US adult calories from ultra-processed foods
A 2016 analysis published in BMJ Open by Martínez Steele and colleagues, based on NHANES dietary recall data.
500 kcal/day
Extra calories consumed on ultra-processed diet
Reported in a 2019 controlled feeding study by Hall et al. published in Cell Metabolism, comparing ultra-processed and minimally processed diet conditions.
4
NOVA classification groups
The NOVA system, developed by researchers at the University of Sao Paulo, groups all foods and beverages into four categories by processing level and purpose.
What the research actually says
A substantial body of epidemiological research associates high consumption of ultra-processed foods with increased risk of cardiovascular disease, type 2 diabetes, and obesity. These are associations, not proof of direct causation, and the research does not isolate processing as the sole variable. Ultra-processed foods also tend to be high in sugar, sodium, and saturated fat, which are independently linked to those outcomes.
A controlled feeding trial published in Cell Metabolism in 2019 by Kevin Hall and colleagues at the National Institutes of Health found that participants given an ultra-processed diet consumed significantly more calories per day than those given a minimally processed diet, even when both diets were matched for total macronutrients. That suggests something about the physical properties or palatability of ultra-processed food may influence how much people eat, though this remains an active area of study.
The practical implication is not that every packaged item is harmful. It is that the balance of the overall diet matters. Eating patterns associated with lower chronic disease risk, such as those described in evidence-based dietary patterns, tend to feature more foods from Groups 1 through 3 and fewer from Group 4.
Using processing level in everyday decisions
The ingredient list is your most direct window into processing level. A can of chickpeas listing "chickpeas, water, salt" sits in Group 3. A flavored chickpea snack with a dozen additives sits in Group 4. Both contain protein and fiber, but they are not nutritionally equivalent.
Protein source is another area where processing intersects with food quality. Plant and animal protein sources vary in amino acid profile and digestibility, but heavy processing affects both. A grilled chicken breast and a processed chicken nugget share a protein source; their overall nutritional profiles differ considerably.
A practical approach is to check whether the ingredient list contains items a home cook would recognize. Longer lists with chemical-sounding additives generally signal heavier industrial processing. That does not mean rejecting every convenience food, but it gives a clearer picture than a simple "processed vs. natural" label.
This article is general nutrition information and education, not personal dietary advice. Consult a registered dietitian or qualified healthcare professional for guidance specific to your health needs.